Authors

Image descriptions are now available in Transform! Set one flag on a parse request and every detected figure comes back with a written description of what it shows, including values read off the chart. This option defaults to off, so nothing will change on existing calls until you enable it.
curl https://transform.unstructured.io/api/v2/parse \
  -H "unstructured-api-key: $UNSTRUCTURED_API_KEY" \
  -F "input=@report.pdf" \
  -F "profile=best" \
  -F 'advanced_options={"enrichments":{"image_description":true}}'
The problem this solves
Here is a figure from the National Hurricane Center's report on Hurricane Helene, page 61.
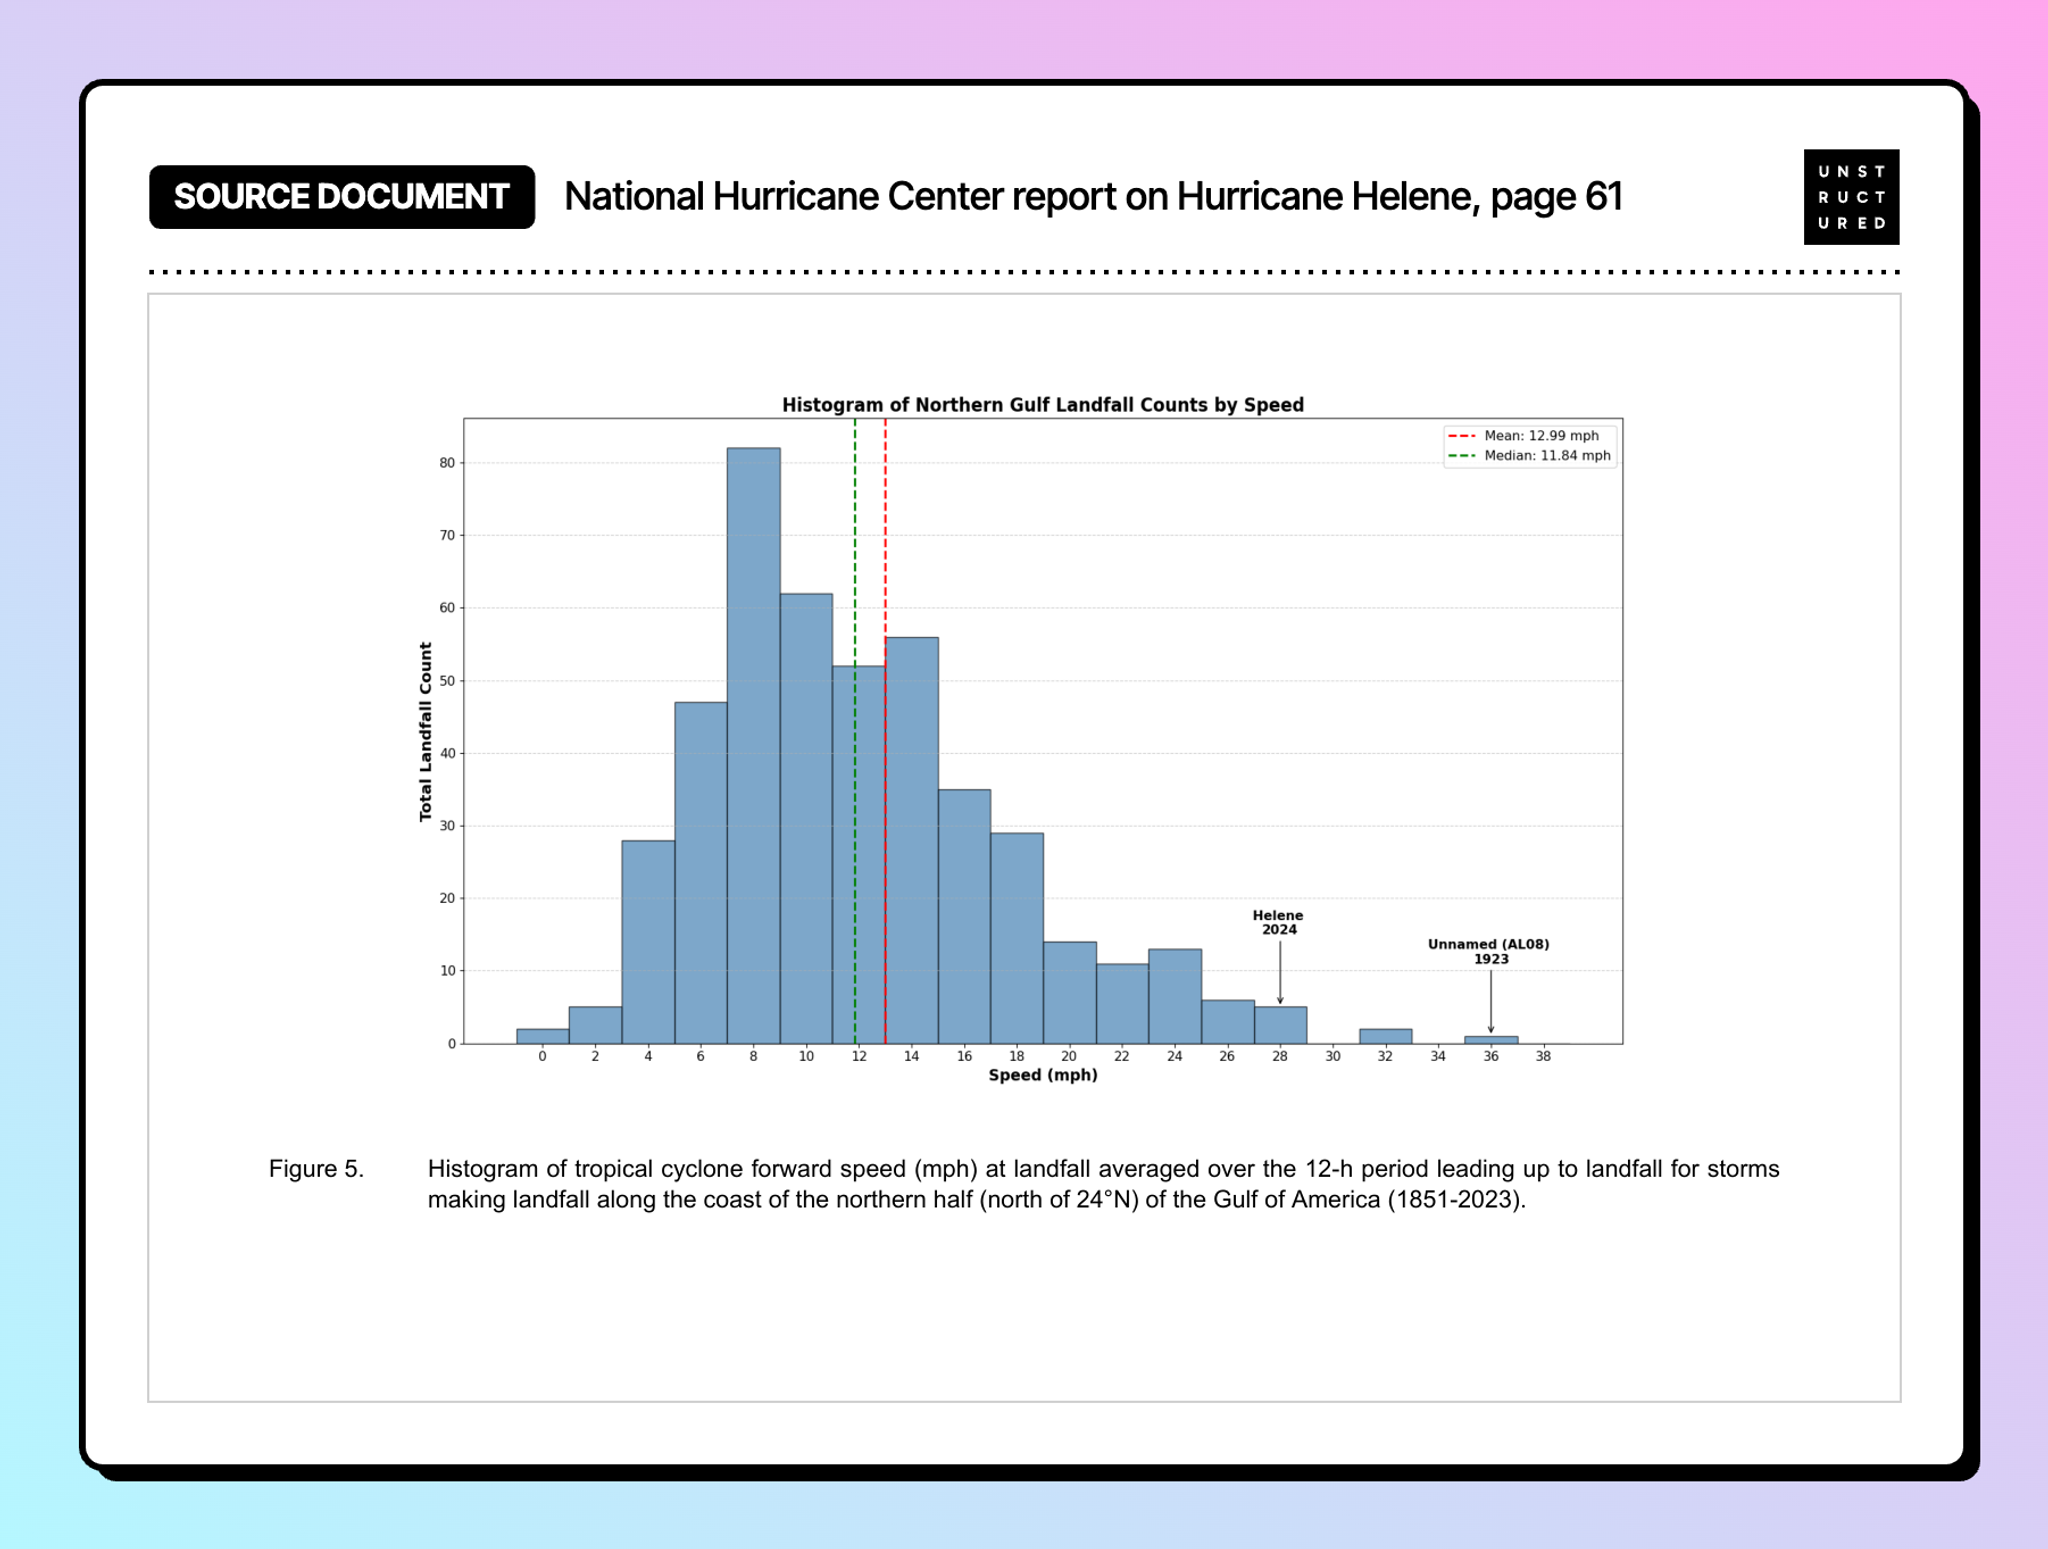
Everything interesting about that page is in the picture. The report's text never states the shape of the distribution, where it peaks, or how Helene compared to the historical record. The chart is the finding.
Parse that page without the image description enrichment and the figure comes back like this:
Histogram of Northern Gulf Landfall Counts by Speed
Mean: 12.99 mph
Median: 11.84 mph
Total Landfall Count
0
10
20
...
80
Helene
2024
Unnamed (AL08)
1923
0
2
4
...
36
38
Speed (mph)
Every label arrives on its own line with nothing tying it to anything else. Helene and 2024 come through as two separate lines, and nothing in the output connects them to the bar the arrow points at or to its position on the speed axis. The tick values are a bare sequence of numbers. Ask an index built from this chunk whether Helene was moving unusually fast at landfall, and there is nothing to retrieve even though the answer is in the picture with an arrow pointing at it.
What comes back
Same page, same request, with the image description enrichment on:
A histogram showing the distribution of Northern Gulf Landfall Counts by Speed (mph). The x-axis represents Speed in mph ranging from approximately -2 to 38, and the y-axis represents Total Landfall Count ranging from 0 to 85. The distribution is right-skewed with a peak at the 8-9 mph bin reaching approximately 82 counts. Two vertical dashed lines mark the Mean (12.99 mph, red dashed) and Median (11.84 mph, green dashed). Two specific storms are annotated with arrows: 'Helene 2024' at approximately 28 mph and 'Unnamed (AL08) 1923' at approximately 36 mph. The distribution tapers off significantly after 20 mph with very few landfalls above 30 mph.
The description lands in the markdown where the figure sits, so it chunks and embeds with the surrounding text.
The index can now answer the original question. Helene at roughly 28 mph against a mean of 12.99 sits in the far tail of the northern Gulf record going back to 1851, with only three landfalls in a faster bin. None of that appears in the document's text.
A harder case
A histogram has one series. Here is Figure 2 from the same report, a track map where the storm's intensity over time is encoded as the color of the line.
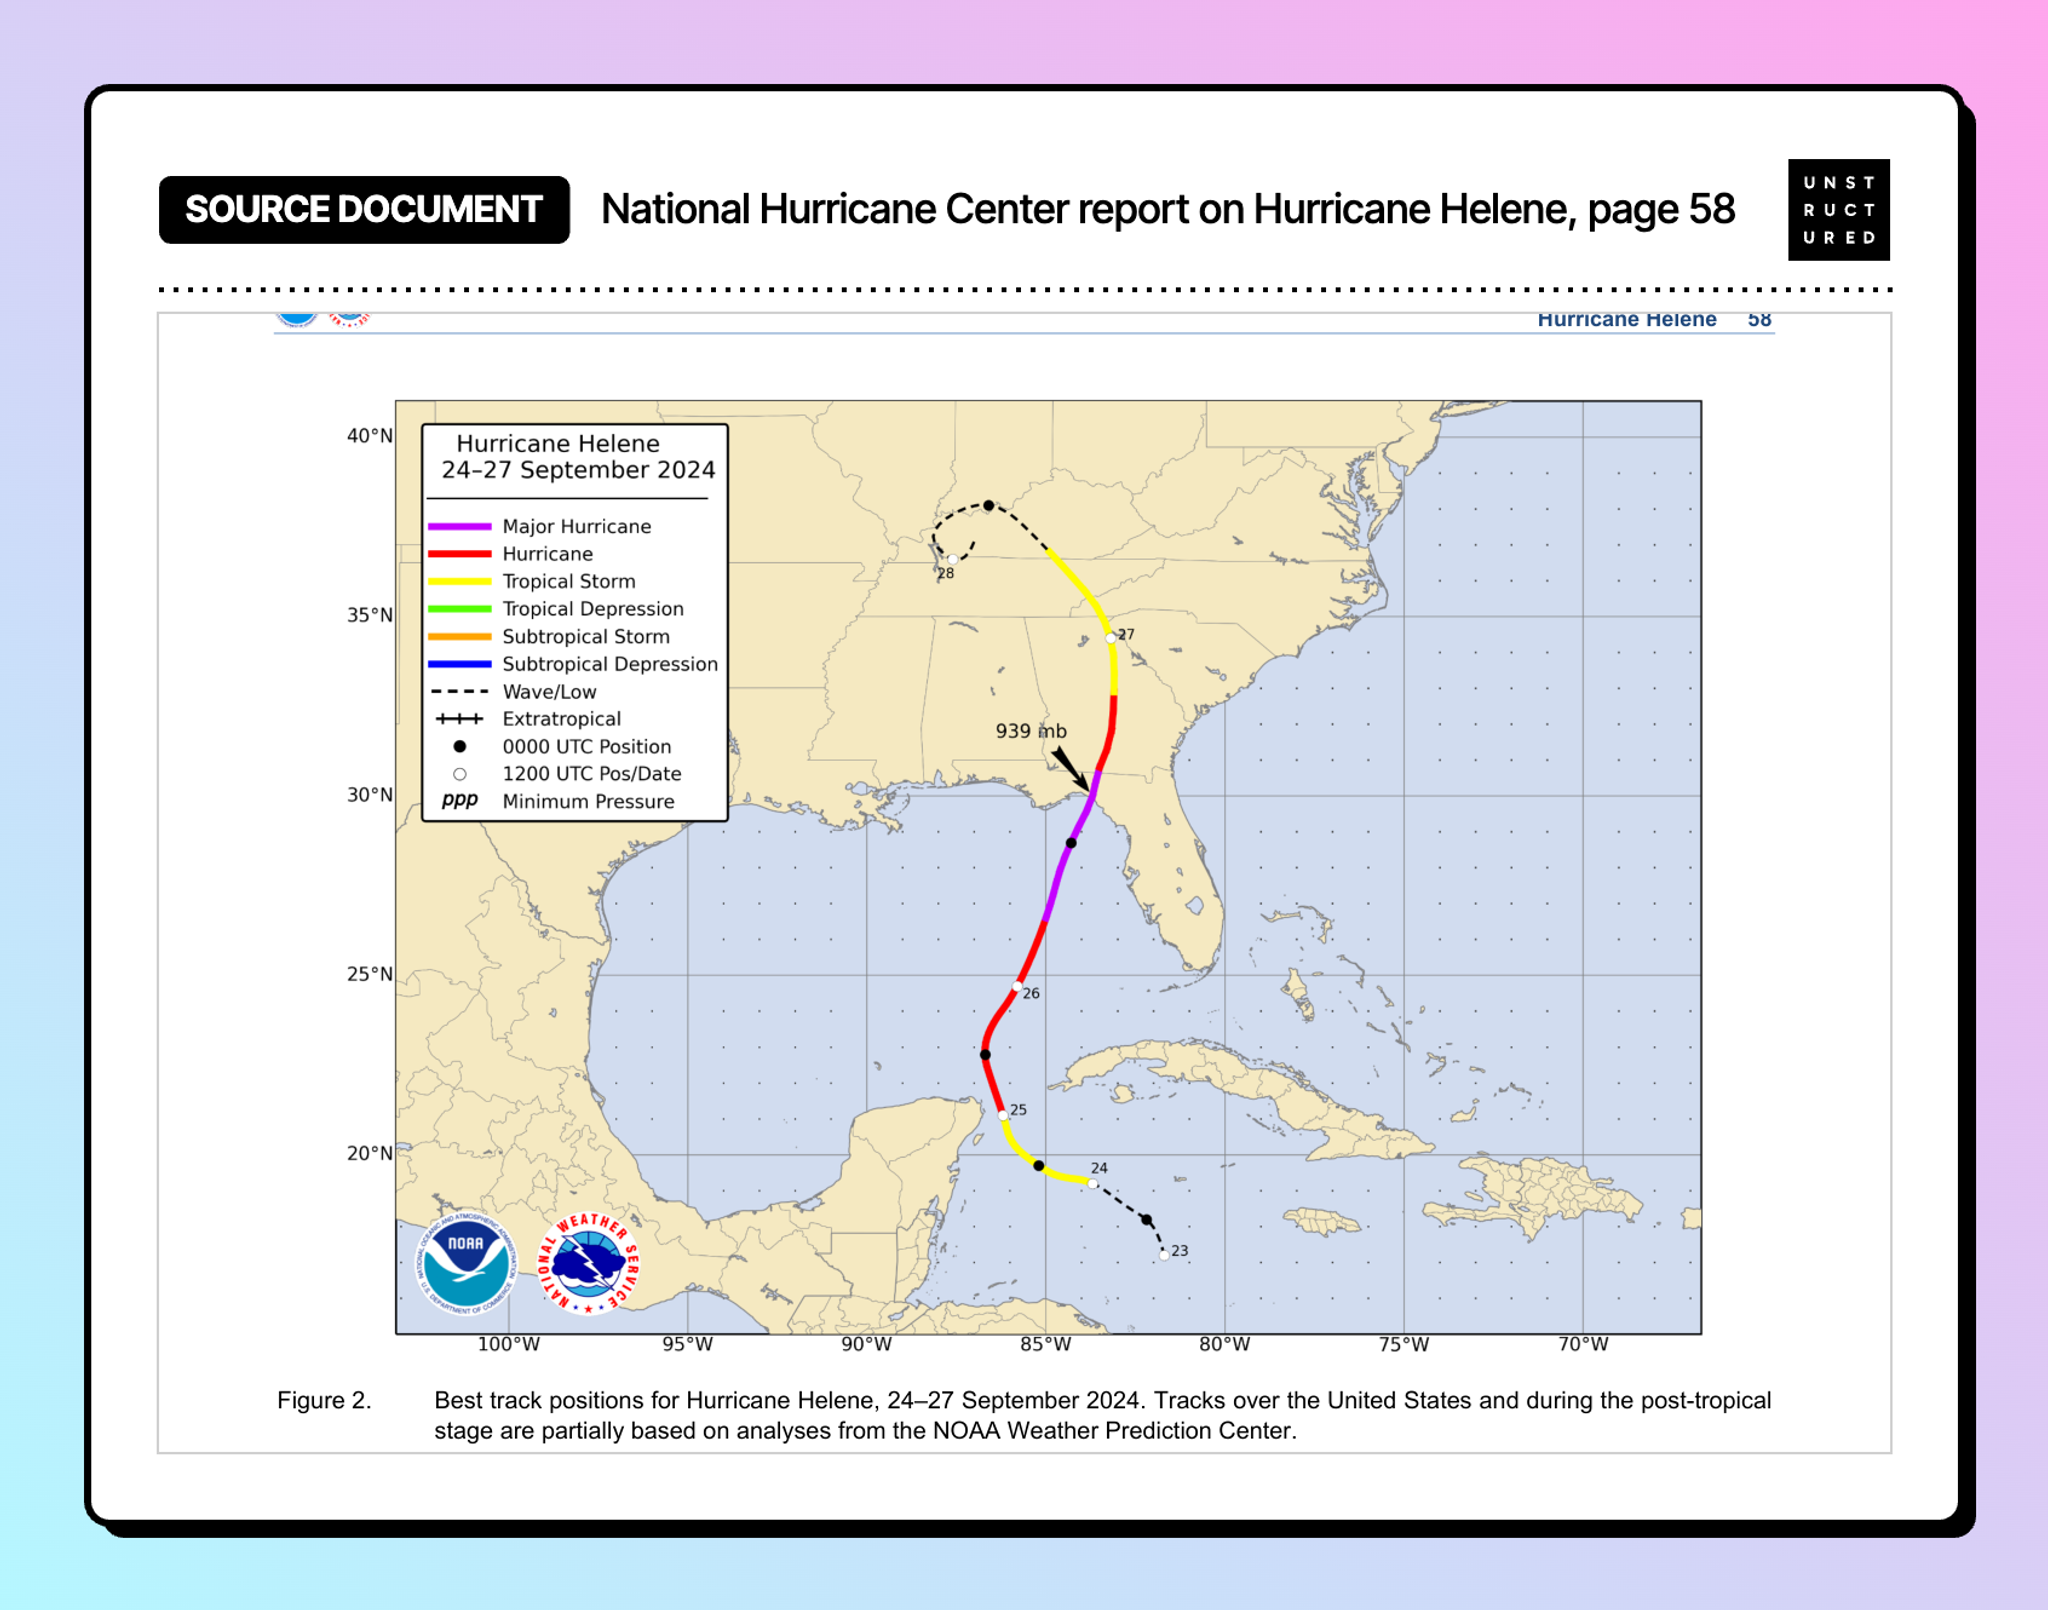
Nothing about the storm's path exists as text on that page. The description reconstructs it:
From September 24-25, the storm is shown as a Tropical Storm (yellow line). From September 25-26, it intensifies to a Hurricane (red line). From September 26 to landfall near the Florida Big Bend area, it becomes a Major Hurricane (purple line) with a minimum pressure of 939 mb recorded near landfall around 29-30°N. After landfall, the storm weakens back to a Tropical Storm (yellow line) and continues northward through Georgia and into Tennessee/Kentucky area by September 27 [...] By September 28, the storm has become extratropical (dashed line) and curves back westward, labeled '28', reaching approximately 37°N, 88°W.
It read the legend, matched each color to an intensity category, walked the track in order, picked up the 939 mb annotation and placed it at landfall, and named the landfall region. The dated positions it lists, Sep 24 near 19°N 85°W through Sep 28 near 37°N 88°W, land on the plotted points.
A retrieval system holding that description can answer when Helene reached major hurricane status and where it was when it did. Neither fact is anywhere in the document's text.
What to expect from the descriptions
Values printed on the chart come back exactly: the mean of 12.99, the median of 11.84, the peak count of 82, and both storm annotations with their speeds. Values read off the geometry rather than printed come back close, which is the right precision for retrieval, where you are matching a question to a chunk and a small difference does not change which chunk wins. When you need to compute on a number rather than find it, go to the underlying table.
Descriptions come back as prose. If you want the figure as structured data, pass a schema on the same request and you get both. Here is the schema, asking for the title, the axis labels, the summary statistics and any annotated points:
{"type": "object", "properties": {
  "chart_title":   {"type": "string"},
  "x_axis_label":  {"type": "string"},
  "y_axis_label":  {"type": "string"},
  "mean":          {"type": "number"},
  "median":        {"type": "number"},
  "annotated_points": {"type": "array", "items": {"type": "object", "properties": {
      "label": {"type": "string"}, "speed_mph": {"type": "number"}}}}
}}
curl https://transform.unstructured.io/api/v2/parse \
-H "unstructured-api-key: $UNSTRUCTURED_API_KEY" \
-F "input=@helene-figures.pdf" -F "profile=best" \
-F 'advanced_options={"enrichments":{"image_description":true}}' \
-F "schema=$(cat chart-schema.json)"Run against the pages holding the figures above, extracted_data comes back as:
{
  "chart_title": "Histogram of Northern Gulf Landfall Counts by Speed",
  "x_axis_label": "Speed (mph)",
  "y_axis_label": "Total Landfall Count",
  "mean": 12.99,
  "median": 11.84,
  "annotated_points": [
    {"label": "Helene 2024", "speed_mph": 28},
    {"label": "Unnamed (AL08) 1923", "speed_mph": 36}
  ]
}
One call, and the chart arrives as fields you can write to a table.
Enrichment runs a vision model over every figure it detects, so calls can take longer, and how much longer depends on how many figures the document has. Turn it on for the document classes where figures carry findings.
Try it yourself
Sign up for Transform today! The hurricane report is public, in the NHC report archive. Pick one with charts, run it both ways, and compare for yourself.
Full parameter reference is in the parse endpoint docs.