Authors

We all recognize the power of quarterly earnings reports. They’re a goldmine for investors keen on evaluating a company’s performance. Yet, the tedious task of poring over these documents often feels like a never-ending maze. There’s a hope that technology might be our guiding light, but not all solutions are up to the task. Take, for instance, traditional AI models like ChatGPT. While impressive, they struggle with lengthy, unstructured documents. Even the latest large language models (LLM) hit roadblocks; they have constraints in processing vast volumes of data, can’t interpret visual content, and their knowledge is “frozen in time”, anchored only to their last training update.
To address these shortcomings, one might turn to a Retrieval Augmented Generation (RAG) pipeline, supercharged by Unstructured’s library.
In the following blog I am going to go through a step by step guide on how to analyze long financial documents with a RAG pipeline that leverages the computational strength of a LLM and the memory of a vector database while showcasing the table extraction capabilities of Unstructured’s library. In this blog we will be using LangChain, ChromaDB and OpenAI’s embedding “ada” model and their LLM “davinci”. However, feel free to use whatever vector db or LLM you’d like!
Why Unstructured?
Unfortunately, when you extract just the text from the earnings report, the LLM cannot process or understand the table structures. However, with the aid of Unstructured’s library, these structures can be rendered in an HTML format. Notably, when presented in this format, LLMs are adept at discerning and analyzing the row and column layout of tables.
Getting Started
Prerequisites:
- Install Unstructured from PyPI or GitHub repo
- Obtain OpenAI API Key here
- Basic technical skills
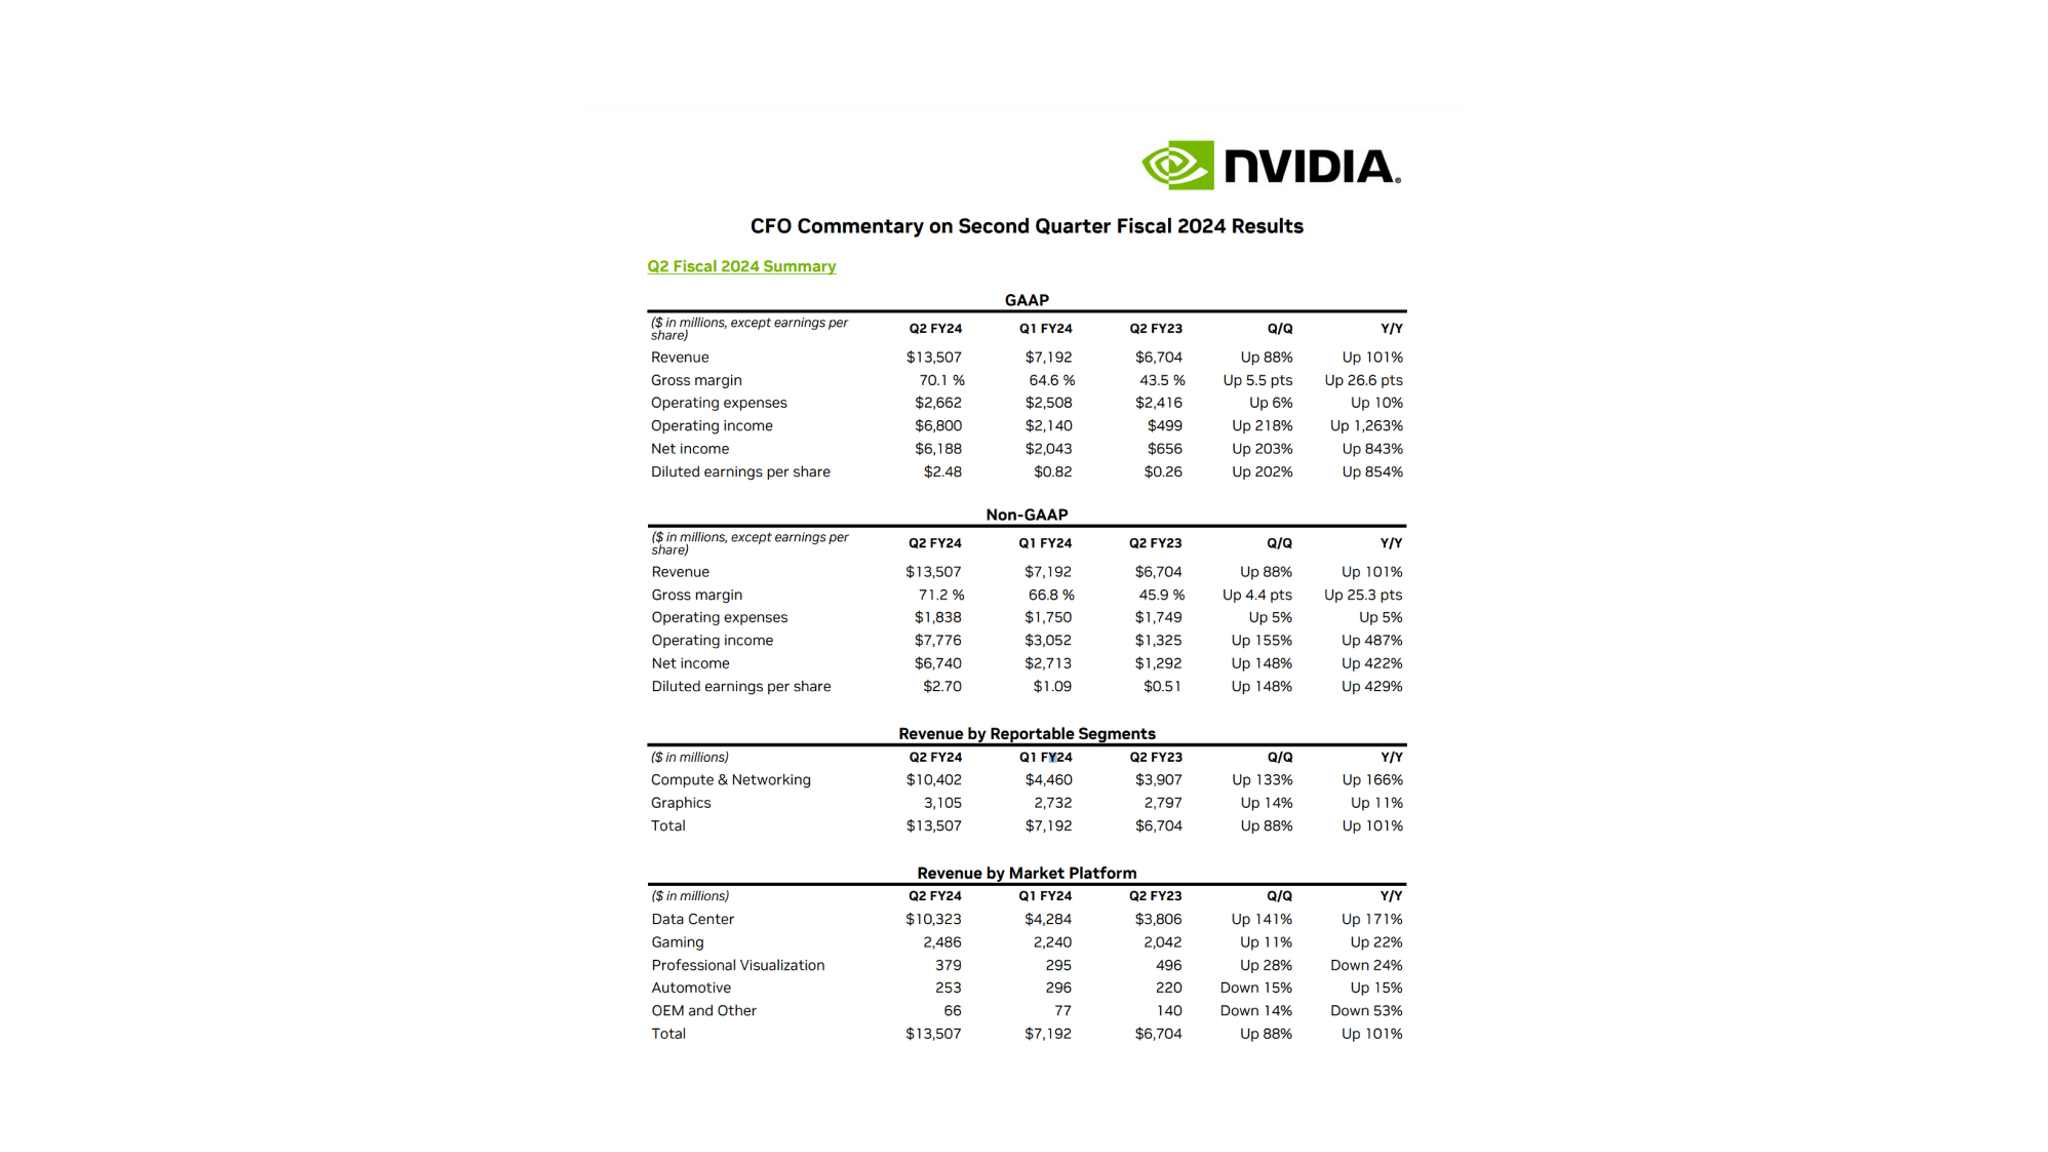
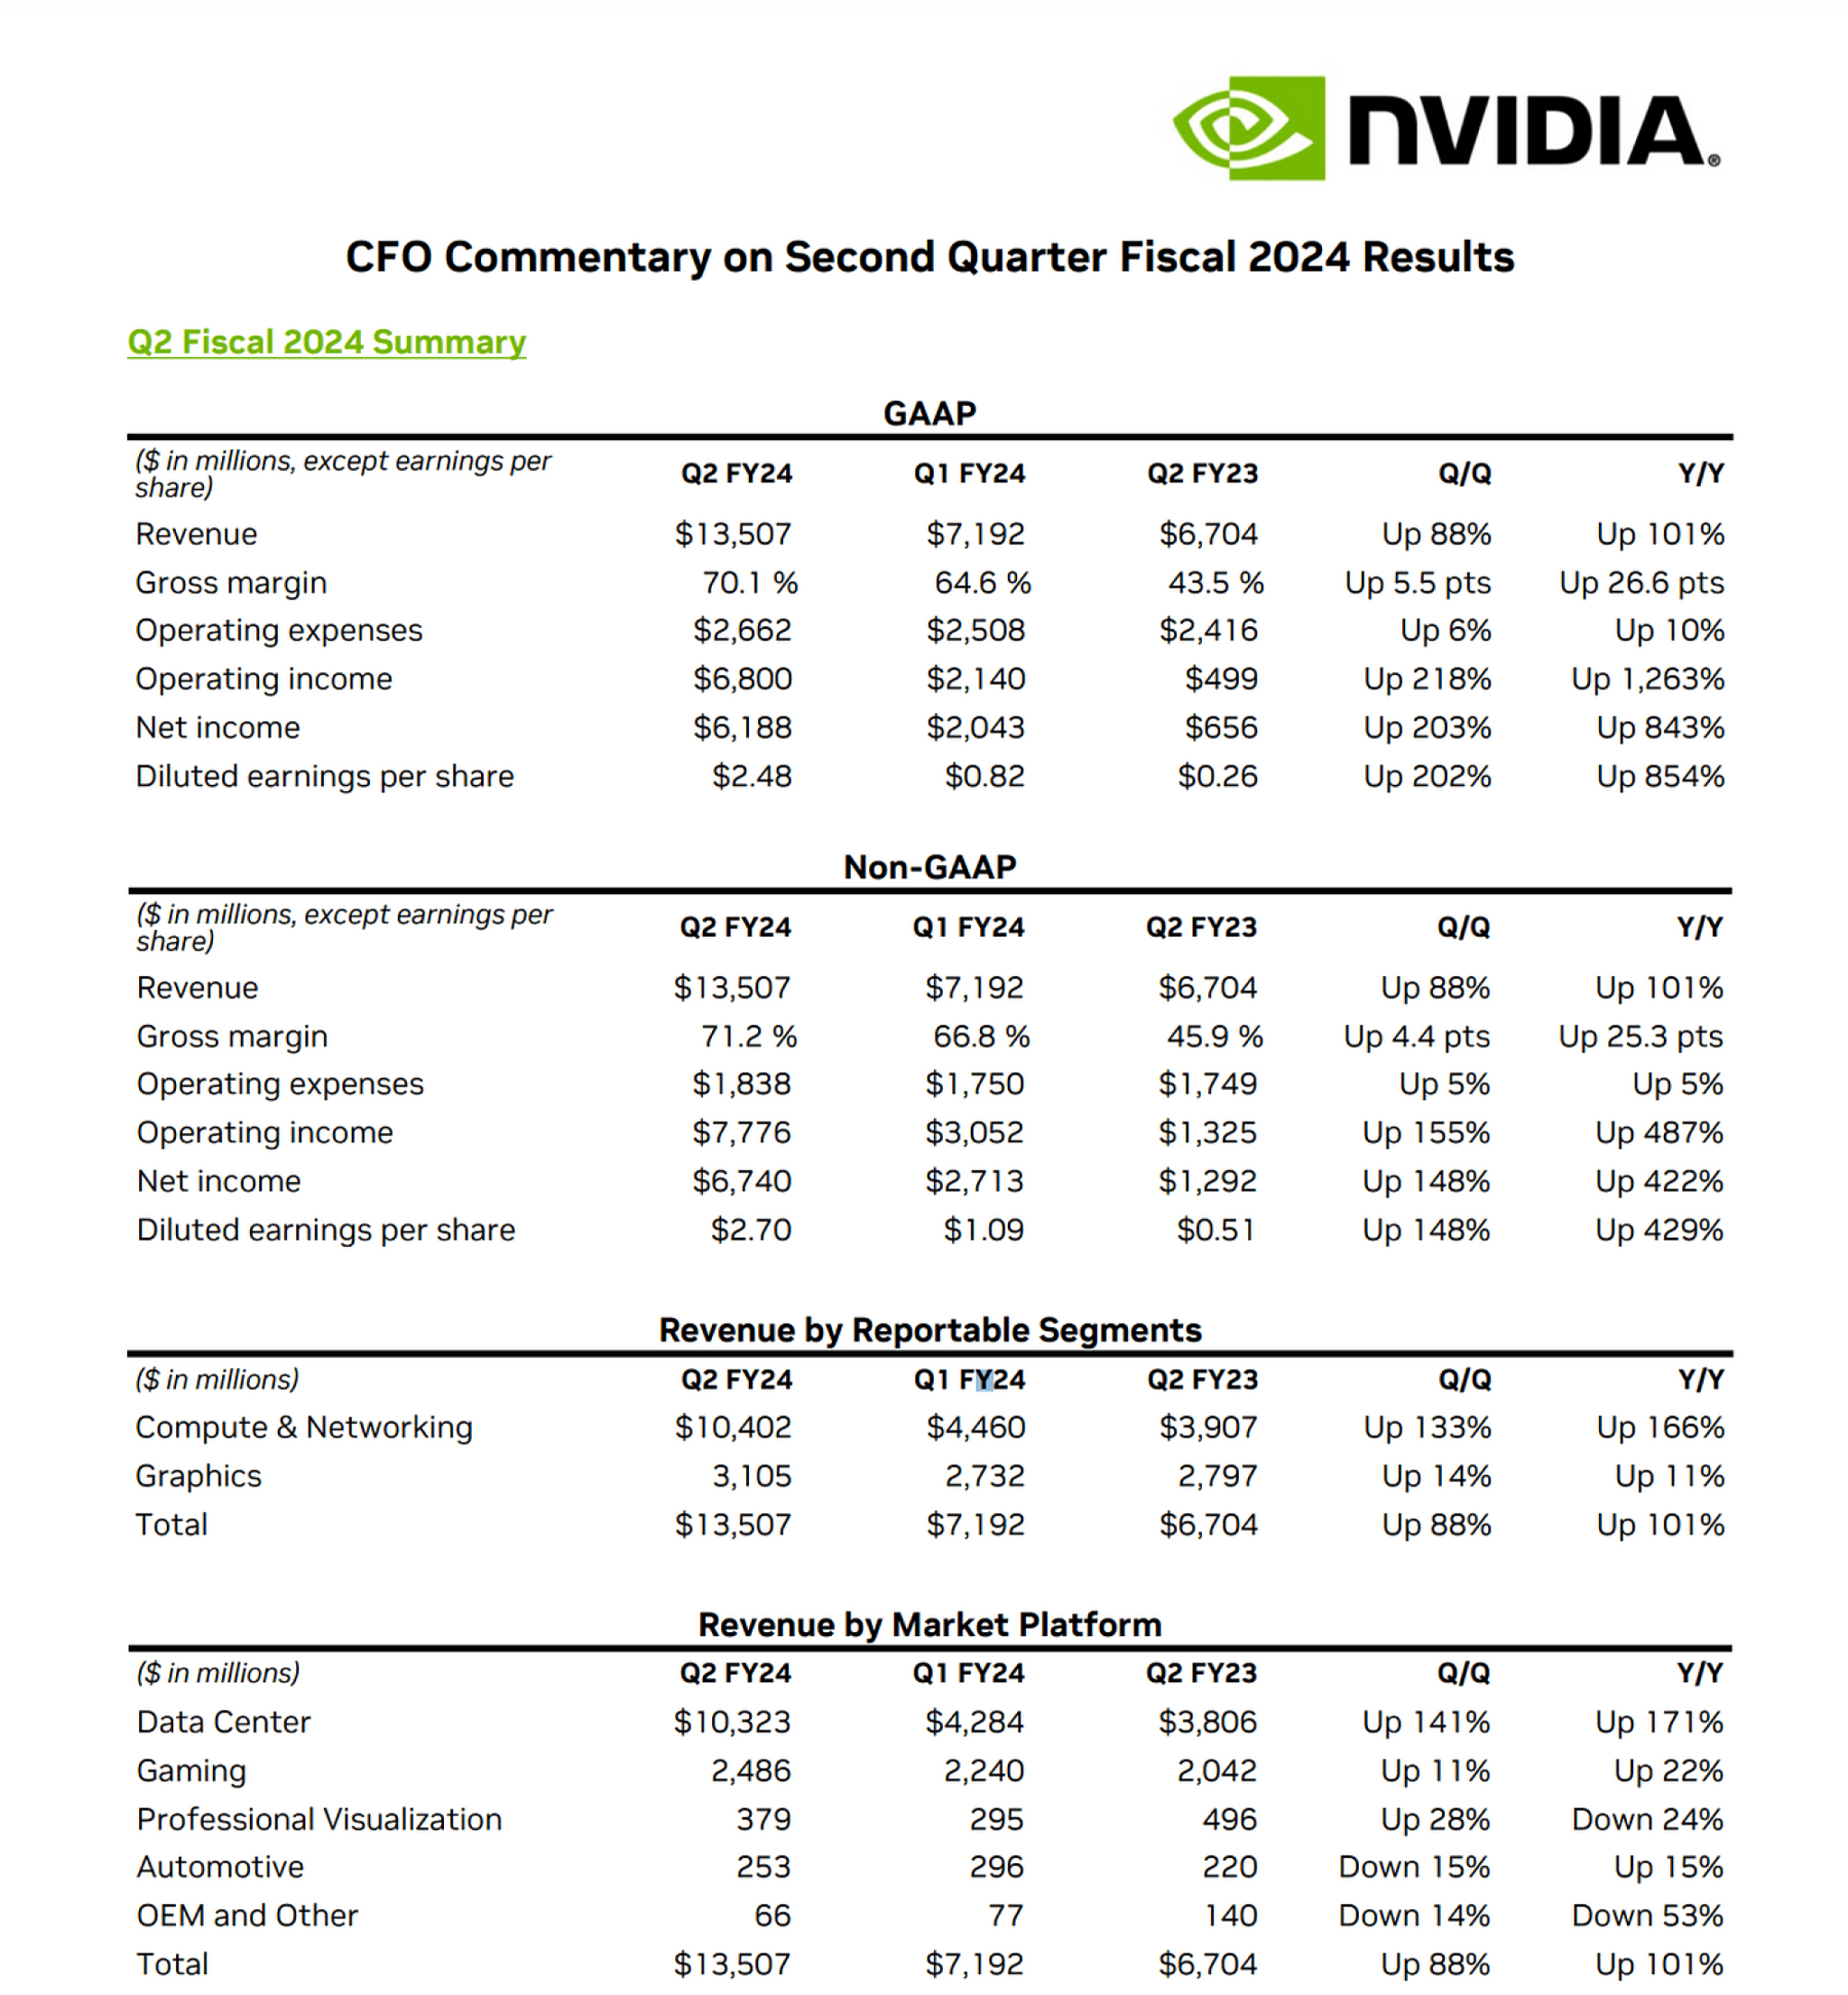
For the purpose of this tutorial I am analyzing Nvidia’s earning reports. They can be found here. I am going to be storing the downloaded PDFs into a local folder for access. The first page of the earnings report looks like this:

Data Ingestion
Follow these instructions in the repository to install the library and please make sure to install the additional dependencies below:
!pip install unstructured unstructured-inference langchain openai chromadb
Once you’ve obtained your earnings reports now we can begin to extract their tables for analysis.
import osfrom unstructured.partition.pdf import partition_pdffrom unstructured.staging.base import elements_to_jsonfilename = "/Path/To/Your/File" # For this notebook I uploaded Nvidia's earnings into the Files directory called "/content/"output_dir = "/Path/To/Your/Desired/Output"# Define parameters for Unstructured's librarystrategy = "hi_res" # Strategy for analyzing PDFs and extracting table structuremodel_name = "yolox" # Best model for table extraction. Other options are detectron2_onnx and chipper depending on file layout# Extracts the elements from the PDFelements = partition_pdf(filename=filename, strategy=strategy, infer_table_structure=True, model_name=model_name)# Store results in jsonelements_to_json(elements, filename=f"{filename}.json") # Takes a while for file to show up on the Google Colab
Data Preprocessing
Having extracted the elements, we can now filter and retain only the table elements. For this example we will ignore all the paragraphs and titles and solely focus on the tables for our analysis.
In order to extract only the table elements I’ve written a helper function to do so:
def process_json_file(input_filename):# Read the JSON filewith open(input_filename, 'r') as file:data = json.load(file)# Iterate over the JSON data and extract required table elementsextracted_elements = []for entry in data:if entry["type"] == "Table":extracted_elements.append(entry["metadata"]["text_as_html"])# Write the extracted elements to the output filewith open("/Path/To/Your/Desired/Output/nvidia-yolox.txt", 'w') as output_file:for element in extracted_elements:output_file.write(element + "\n\n") # Adding two newlines for separation
We can now run the helper function using our JSON file.
process_json_file(f"{filename}.json") # Takes a while for the .txt file to show up in Colab
With the tables’ HTML now stored in a .txt file, we can utilize LangChain’s document loader. This tool greatly simplifies the subsequent steps.
from langchain.document_loaders import TextLoaderloader = TextLoader(text_file)documents = loader.load()
The next step is to chunk our information into smaller more digestible chunks for our LLMs. We need to do so for a few reasons. The first is that LLMs have limited context windows and what that means is that they can only process a certain amount of words before they return an error. The second is that there is some research showing that when larger contexts are provided to LLMs they struggle to process information in the middle of the chunks. So reducing the chunk size might be a solution to it. If you are curious about the research feel free to read more about it here.
from langchain.text_splitter import CharacterTextSplitter# split it into chunkstext_splitter = CharacterTextSplitter(chunk_size=1000, chunk_overlap=200)docs = text_splitter.split_documents(documents)
Now that we have our chunks we can embed them using OpenAI’s ada model. There are other options such as Sentence Transformers and Cohere but for consistency purposes I stuck with OpenAI.
from langchain.embeddings.openai import OpenAIEmbeddingsos.environ['OPENAI_API_KEY'] = "<YOUR-API-KEY>"embeddings = OpenAIEmbeddings()
Vector Database
For this tutorial I have also elected to use ChromaDB but there are many options out there each with their own strengths and weaknesses. But Chroma makes it very easy to get started.
import chromadbfrom chromadb.utils import embedding_functionsdb = Chroma.from_documents(docs, embeddings)
Generation
With everything in place, we can now directly query the financial document’s tables.
from langchain.chat_models import ChatOpenAIfrom langchain.chains import RetrievalQA# Initialize your model and retrieverllm = ChatOpenAI(model_name="gpt-3.5-turbo", temperature=0)qa_chain = RetrievalQA.from_chain_type(llm, retriever=db.as_retriever())# List of questionsquestions = ["How much revenue did Nvidia make in Q2 FY24?","What was the operating income for Q2 FY24?","How much was the net income in Q1 FY24?","What was the Q/Q revenue growth between Q1 and Q2 of FY24?","How much revenue did Nvidia's Data Center produce in Q2 FY24?","How much revenue did Nvidia's Gaming sector produce in Q2 FY24?","What percent of the total revenue in Q2 FY24 did Data Centers represent?"]# Store responses in output_listoutput_list = []for query in questions:response = qa_chain({"query": query})output_list.append(response)
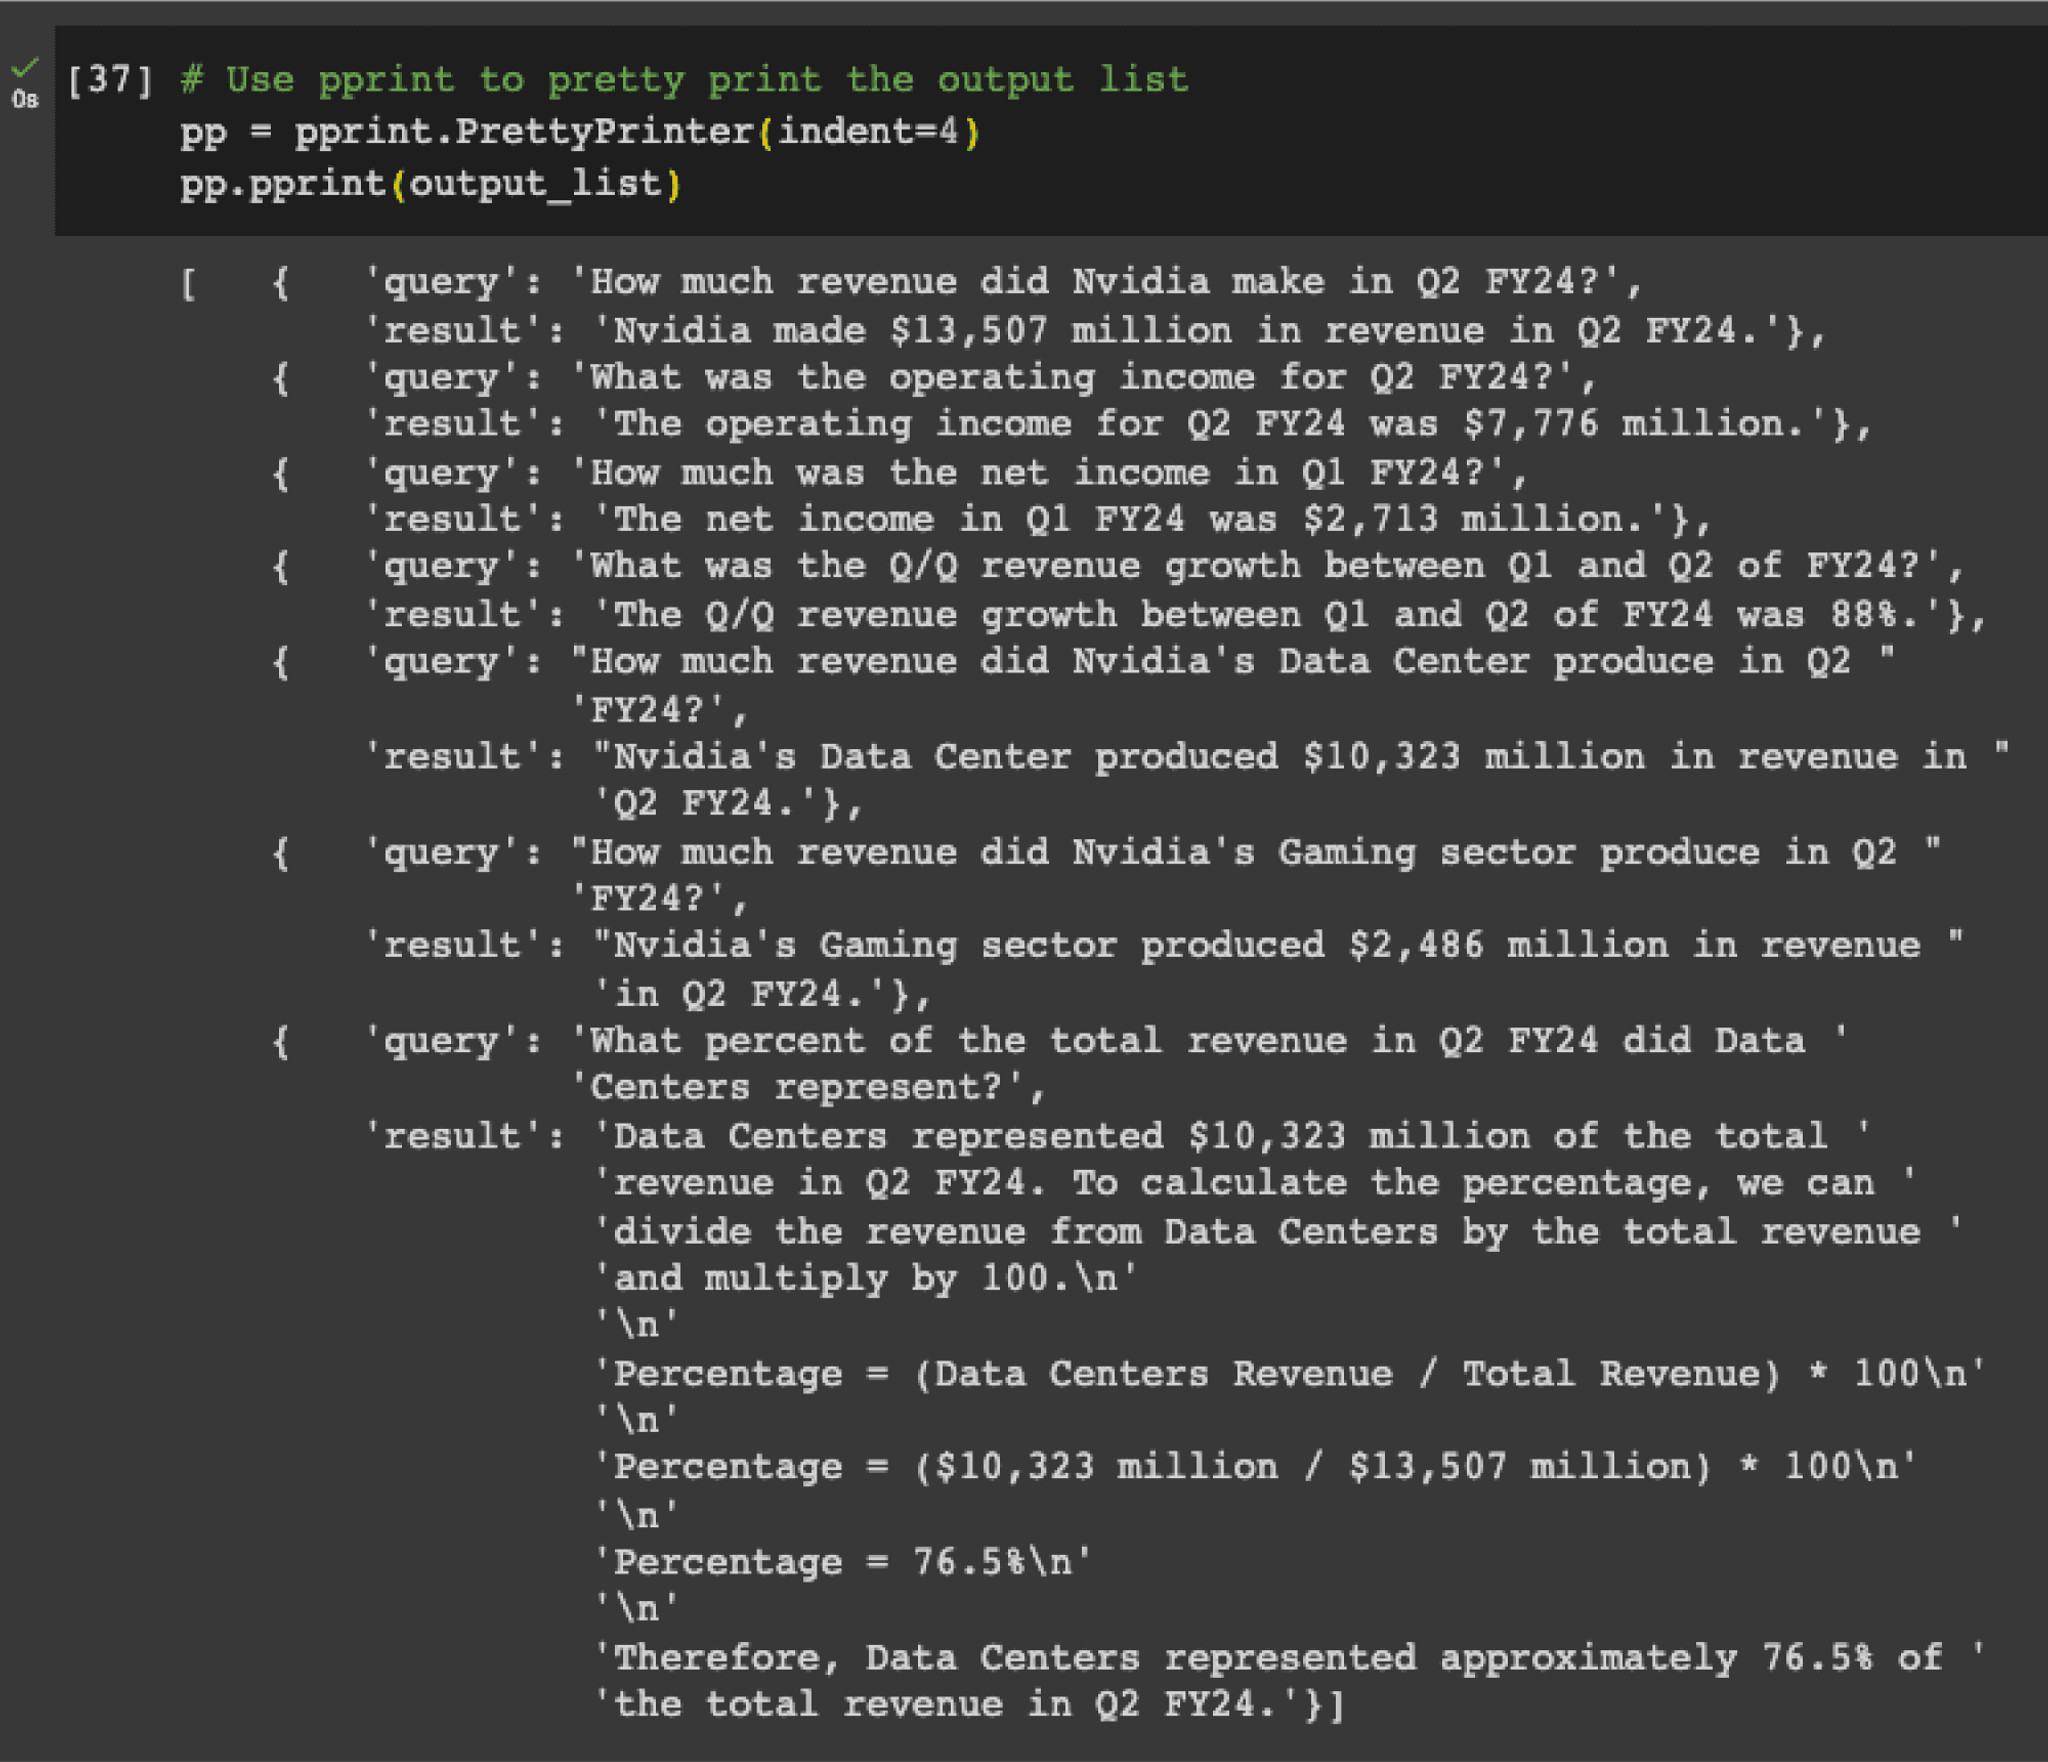
Now we can print the results. I chose to use pprint for legibility reasons.
import pprint# Use pprint to pretty print the output listpp = pprint.PrettyPrinter(indent=4)pp.pprint(output_list)
Output:

Closing Thoughts
Throughout this notebook, we’ve highlighted the capability of Unstructured’s library in rendering accurate HTML representations for tables, and how LLMs adeptly interpret these table structures to furnish comprehensive analysis and summaries. Yet, there remains room for refinement.
One notable observation is the omission of table titles in the generated HTML. This can sometimes mislead our generation process. For instance, querying “operating income for Q2 FY24” may yield Non-GAAP figures in certain instances and GAAP in others. By integrating the table’s HTML with the core text of the document, we believe that table titles could be better incorporated, potentially enhancing the results. However, to maintain clarity and brevity for this post, we’ve opted for a simpler presentation.
Furthermore, we’ve pinpointed a challenge with our table extraction models, particularly when faced with tables displaying varied row background colors — a common trait in quarterly earnings reports. In response, we’re optimizing an image-to-text model with aspirations of elevating our table extraction performance. Stay tuned for more updates on this in the upcoming weeks!
If you have any questions or encounter any issues please join our community Slack channel.
The full code for this blog can be found in this Google Colab notebook.


